Hello Guys here is a quick wrap up of the figures about Facebook in 2010 to pimp up your PPT presentation and shine with client conversations. Enjoy (NB – sorry, it’s translated through Google Translate … don’t be surprise if you have strange sentences 🙂
Article in Google Translate Facebook in 2010, usage and stats.
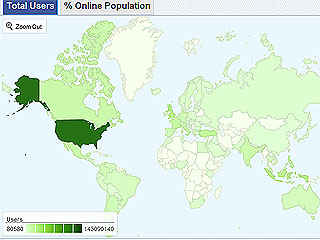
1. Etats Unis 143 090 140 / +22 223 040 / +15.53% / 46.12% USA 143 090 140 / +22 223 040 / +15.53% / 46.12%
2. 2. Indonésie 29 844 240 / +6 377 660 / +21.37% / 12.28% Indonesia 29 844 240 / +6 377 660 / +21.37% / 12.28%
3. 3. Royaume Uni 27 969 360 / +3 973 180 / +14.21% / 44.86% United Kingdom 27 969 360 / +3 973 180 / +14.21% / 44.86%
4. 4. Turquie 23 129 020 / +2 285 900 / +9.88% / 29.73% Turkey 23 129 020 / +2 285 900 / +9.88% / 29.73%
5. 5. France 19 677 640 / +2 062 980 / +10.48% / 30.38% France 19 677 640 / +2 062 980 / +10.48% / 30.38%
6. 6. Philippines 17 942 340 / +4 758 640 / +26.52% / 17.96% Philippines 17 942 340 / +4 758 640 / +26.52% / 17.96%
7. 7. Italie 17 334 140 / +1 366 940 / +7.89% / 29.84% Italy 17 334 140 / +1 366 940 / +7.89% / 29.84%
8. 8. Canada 16 900 320 / +2 630 860 / +15.57% / 50.06% Canada 16 900 320 / +2 630 860 / +15.57% / 50.06%
9. 9. Mexique 16 792 660 / +5 979 680 / +35.61% / 14.93% Mexico 16 792 660 / +5 979 680 / +35.61% / 14.93%
10. 10. Inde 15 176 240 / +6 298 300 / +41.50% / 1.29% India 15 176 240 / +6 298 300 / +41.50% / 1.29%